As teachers, we constantly hear that we should use data to drive instruction. However, that’s easier said than done. I’ve spent more than a few hours staring at numbers trying to figure out how to use that information to meet my students’ needs. Well, I’ve finally found some ways that work.
How to Use Data to Drive Instruction
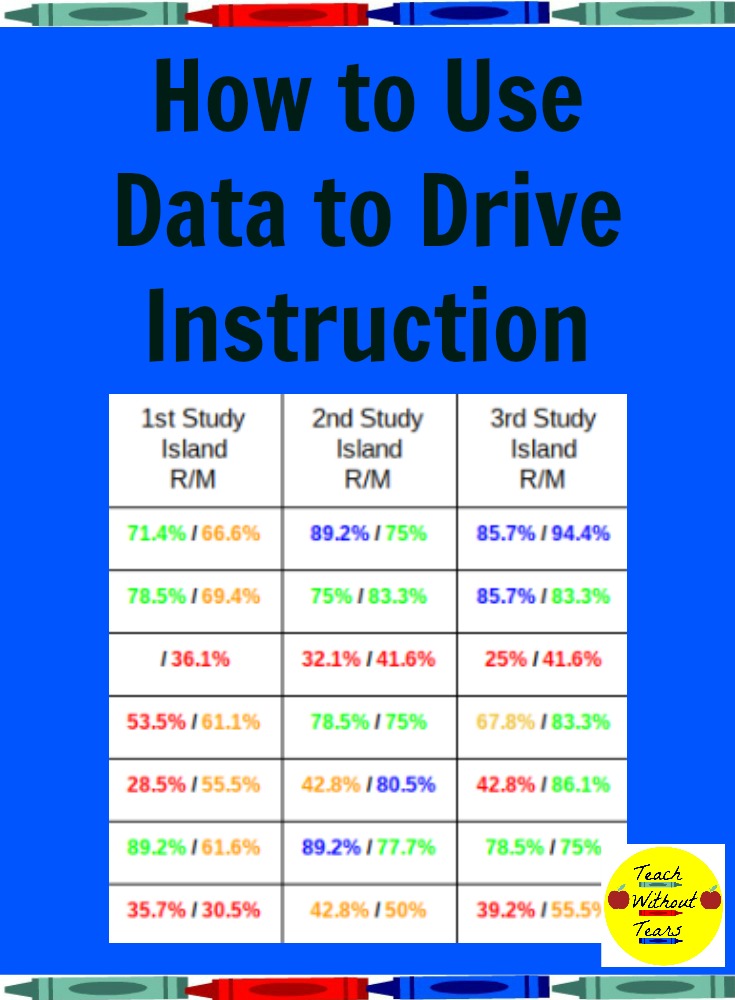
MAP, CDT, Study Island, 4Sight. . .we give our students so many tests to see how they will do on state standardized assessments. The results are graphs, numbers, and charts that make your head spin.
I’ve spent hours at inservices, during planning periods, and at home analyzing data and trying to use it to plan lessons. I knew there had to be an easier way to use the data. Here are my top tips for analyzing data.
#1 – Look for trends in the data to plan whole class lessons.
I start by looking at the areas where my class as a whole missed a lot of questions. I drill down to the 5 standards that had the lowest percentages. Then, I plan whole class lessons on those concepts.
For example, on our last CDT, a large number of my students missed questions on point of view. I planned some whole class lessons on the difference between 1st person and 3rd person point of view. We also started talking about point of view more during our read alouds.
For math, the lowest concepts are usually ones we haven’t covered yet. The data shows me which lessons I need to focus on most and which ones I can move through more quickly because my students already understand the concepts.
#2 – Look at individual scores to form small groups.
Once you’ve reviewed the overall data, it’s time to drill down to individual students. Look at the standards you have taught, and see which students missed those questions. Form small groups based on the data.
I use the math data to form my guided math groups. The students who have mastered the standard are in my top group, and they do enrichment activities at the problem solving center. The students who only missed a few questions are in my middle group. The ones who missed most of the questions are in my lowest group, and I work with them longer in my group and give them lots of opportunities to practice the skill.
For reading, I use the data to form strategy groups. I look at the standards we’ve already covered in reading, and I make small groups of students who are still struggling with those skills. During my RtII time and reading workshop, I pull the strategy groups to practice those standards. My students who have already mastered those skills are practicing more advanced reading skills.
Download my strategy groups planning sheet at the bottom of this post.
#3 – Remember that you know your students better than any test.
While these assessments give us valuable data, they may not perfectly reflect your students’ abilities. We just started doing the CDT assessment this year. Each student gets a different number of questions until it finds a just right level. Some of my students ended up answering almost 70 questions. They had to read as many as 10 different passages. Needless to say, they were done by the end of it. Some checked out around question number 30.
In addition to that, one of my students was going on vacation that afternoon and another went home with the flu later that day. Neither of them gave their full effort. The numbers don’t reflect their abilities.
You’ve been with your students since the first day of the school year. You know what they can and can’t do. If your students’ scores don’t match what you see on a daily basis, use your best judgement to decide what groups they need.
#4 – Collect additional data on a regular basis.
If your students’ results don’t match with what you expect, you should have other data to prove where they are with the standards. For reading, I give a standards-based assessment every Friday. I use these to form my strategy groups when my CDT data is outdated. We only do CDT’s two times a year, so my students make progress between those two benchmarks. Here are the assessments I use:
1st Grade Reading Literature Assessments
2nd Grade Reading Literature Assessments
3rd Grade Reading Literature Assessments
3rd Grade Reading Informational Texts Assessments
4th Grade Reading Literature Assessments
4th Grade Reading Informational Texts Assessments
5th Grade Reading Literature Assessments
For math, I use the topic tests from enVision to collect data. When we completely cover a standard, I also give a math assessment to see who has mastered the standard and who needs more practice. These are the assessments I use:
3rd Grade Math Standard Assessments
#5 – Share the results with your students.
Once you have analyzed the data, share it with your students. I only do this after we do the assessment the second time. Then, I pull up a report that shows a graph and how much they have improved in each area. I talk to my students about the areas where they made the most growth. We talk about what they did to show that growth.
Then, we look at areas they could improve. We set goals and make a plan for how to achieve those goals. I am still amazed by how much looking at the graphs motivates my students. They are excited to see their growth, and they are determined to meet their goals.
Hopefully, these tips will save you some time next time you’re using data to drive instruction. Find out how to save more time on grading and lesson plans.
Want more tips to make teaching less stressful? Sign up for the Teach Without Tears newsletter below, and join our private Facebook group to ask all your questions.
What Do You Think?
What tips do you have for analyzing data?
Let me know in the comments below.
If you enjoyed this post and think your teacher friends will, too, please click the button to share it on your favorite social media platform.
I loved this. I am a new teacher and was struggling with group reading . This gave me good strategies. Thanks
I’m so glad it was helpful, Hyacinth! I hope your first year is great!
Hi Tara,
I have a question concerning the guided math group…for those students in the middle group…you mentioned that they missed only a few questions…would you say the most would be two missed questions…I guess Also, while you are with the low group, what would the middle group be doing…chromebooks?
Thanks…great info!!
Ray Burns
Hi Ray!
The number of questions the students miss to be in the middle group really depends on the assessment. When I’m done scoring them, I divide them into 3 semi-equal piles. I try to keep my low group a little bit smaller. The middle and high groups are usually pretty even. Normally it works out that everyone in my high group only missed 1 or 2 questions. Middle is usually between 3 and 5, and low is more than 5.
While I’m meeting with the low group, the middle group is doing the technology center on Chromebooks and the high group is doing problem solving.
I hope that helps!
Tara